|
The LabVIEW IDE gives us a way to visualize class hierarchies but I always thought it would be useful to visualize the source code dependencies between my classes as well, so I put a tool together. 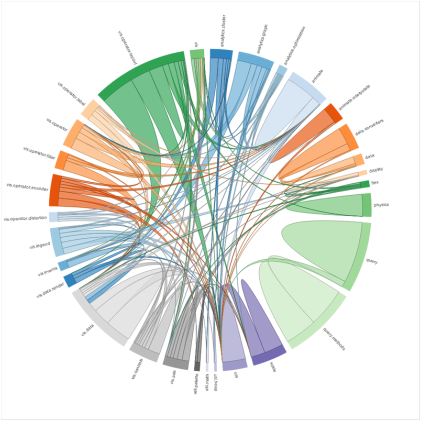 Visualizing source code dependencies between classes is useful because it gives you a qualitative way to analyze the coupling between your classes. We could replace the word "classes" in that sentence with "modules", or "components" and it would still be true. For this post I am going to talk about classes, but the discussion should apply to software without them. I have a few blog posts in the works that will dive deeper into the idea of coupling as a driver for complexity, how it impacts iterative development (like Scrum), and how I design large systems to minimize it. For now we will focus on visualization. 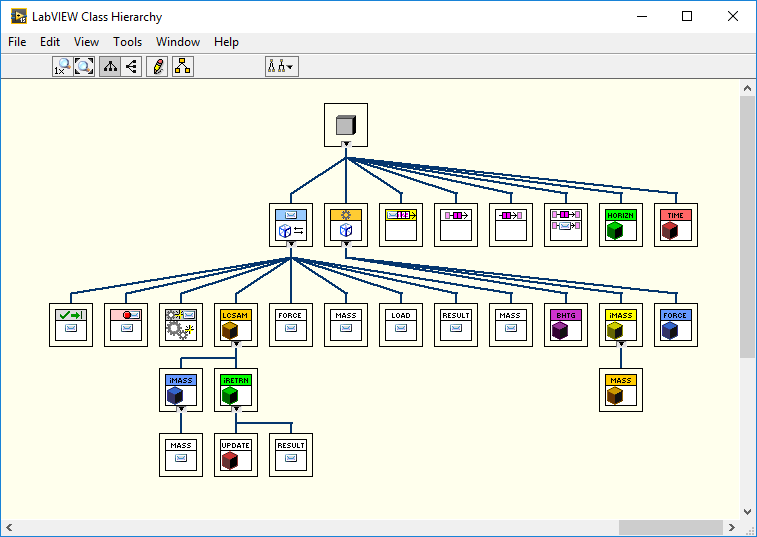 The LabVIEW IDE has a built in tool for visualizing your class hierarchies. This is a very useful tool for visualizing how the code is structured and if you have ever inherited object-oriented code from someone else the LabVIEW Class Hierarchy viewer definitely increases the codes readability. However, this tool does not show you how those classes interact with each other. You could use UML diagrams to show how classes are intended to interact, but I find that they are cumbersome to maintain and that it can be difficult to create them at the level of detail that I want. For example in the class hierarchy above, I have created an abstraction for how a black hole's mass is calculated and I want to know if my other classes are using the abstraction (this is the dependency inversion principle in action). I want a tool to visualize this. 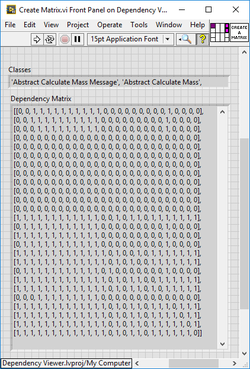 I started Googling for ways to visualize dependencies between classes and found a large number of tools that do it, but they all seem to be language specific. I decided to write some LabVIEW code that would parse the classes in a project and build a dependency matrix that mapped how classes depended on one another. This was useful but it didn't aid in visualizing the dependencies.  I decided that I would take advantage of the cool visualization capabilities of the web, and dove into a javascript library called D3.js. After looking through examples of different diagrams I settled on the chord diagram, and even found a modified version of the chord diagram called a dependency wheel created by François Zaninotto for visualizing dependencies between PHP libraries.  I was able to use some javascript code written for the dependency wheel and refactor a little HTML and without too much trouble had converted the dependency wheel to work as a LabVIEW class dependency visualizer. Here is a demo of it in action. I am planning to upload the LabVIEW code along with the javascript and html behind this implementation of the dependency wheel if anyone is interested in it. Let me know if you find this tool useful. I am also curious how other people visualize dependencies between their LabVIEW classes (modules, components...), let me know if you have a tool that you use and like. Jon McBee is a Principal Software Engineer at Cambridge NanoTech and is a Certified LabVIEW Architect, Certified LabVIEW Embedded Developer, Certified TestStand Developer, an NI Certified Professional Instructor, and a LabVIEW Champion
6 Comments
Mikael HOlmstrom
1/21/2016 02:44:04 pm
Very nice way to quickly getting an overview, great work.
Tom Lawton
1/25/2016 11:33:53 am
Nice use of a best-in-class plotting tool.. ;-)
Marcus Törndahl
1/26/2016 02:50:00 am
I love the way you visualize the dependancy between code modules, really nice. It would be interesting to track the historic changes to the code, stored in a SCC (GIT, SVN,..).
Jon McBee
1/27/2016 03:53:02 pm
Hey Marcus, 4/16/2021 02:34:16 pm
Jon, Leave a Reply. |
Tags
All
Archives
October 2019
LabVIEW Blogs |
 RSS Feed

Powered by the Panda Ant
|