|
I recently needed to create a small LabVIEW application that would allow my customers to view and interact with data they had acquired. As much as I love LabVIEW I really don't love trying to make sleek UI's for data visualization using LabVIEW. So I decided to tinker with embedding JavaScript UI elements in LabVIEW front panels using XControls. It ended up being more fun than it sounds. 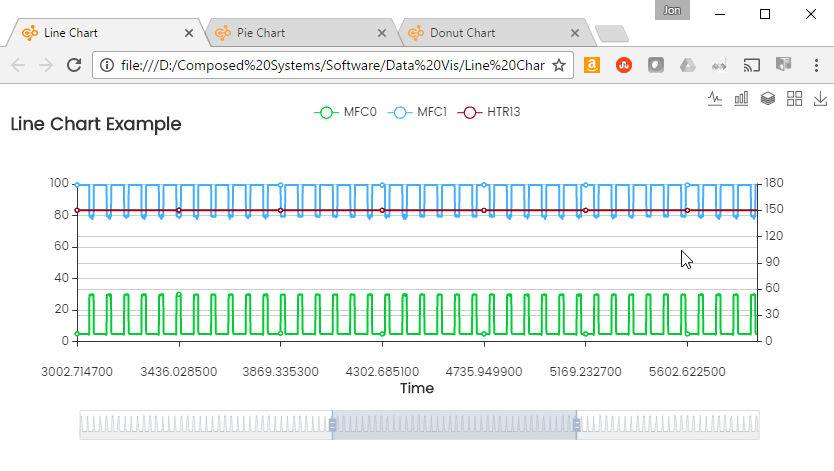 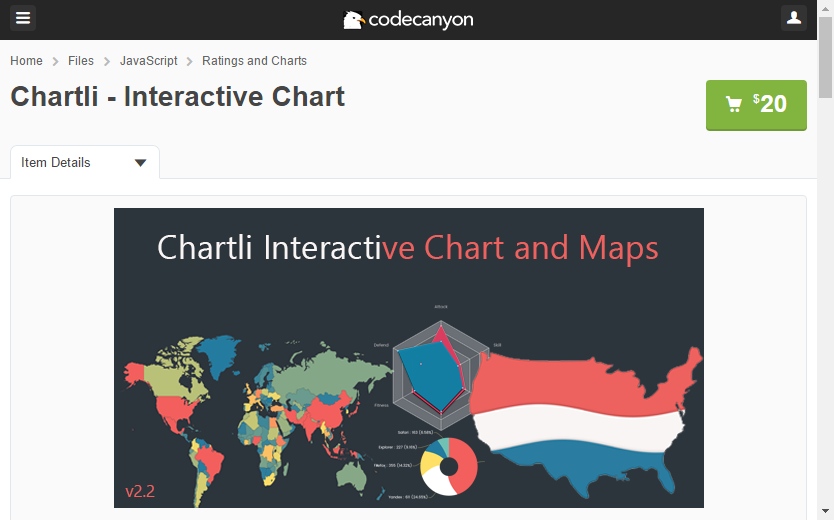 I knew that I wanted a JavaScript charting package and so I did a little Googling and I found too many to count. I decided to buy a canned package that had examples that fit what I wanted to do because there is no way that I could build what I wanted myself for $20 worth of effort. I came across a package called Chartli on codecanyon for $20, it seemed to fit my use case so I purchased a license. 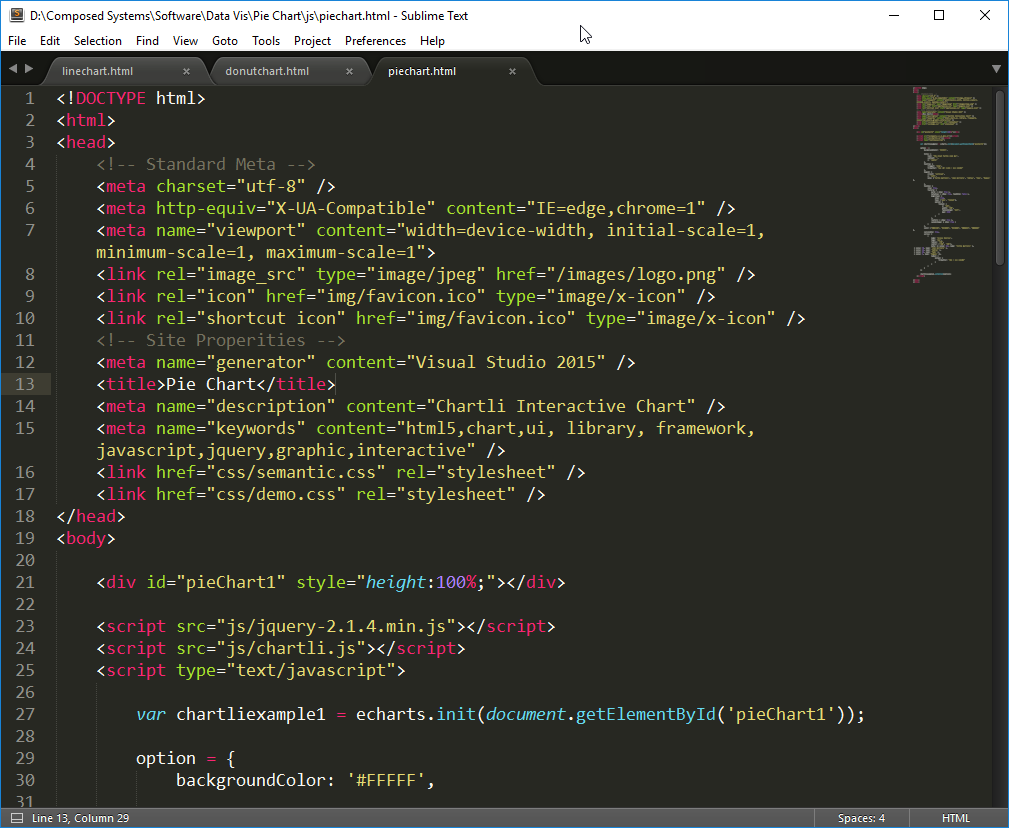 The tangible artifacts that I purchased were HTML files with JavaScript code, JavaScript files, and CSS files. We don't typically deal with these types of artifacts as LabVIEW developers but there is no reason we can't. In fact there is a nice example that ships with LabVIEW called "ActiveX Event Callback.vi", this example uses the Microsoft WebBrowser ActiveX control to load a webpage in the ActiveX control so that it can be embedded in a LabVIEW VI's front panel. As luck would have it, the Chartli package I purchased was just a bunch of webpages that I could tweak and embed in an ActiveX Control. 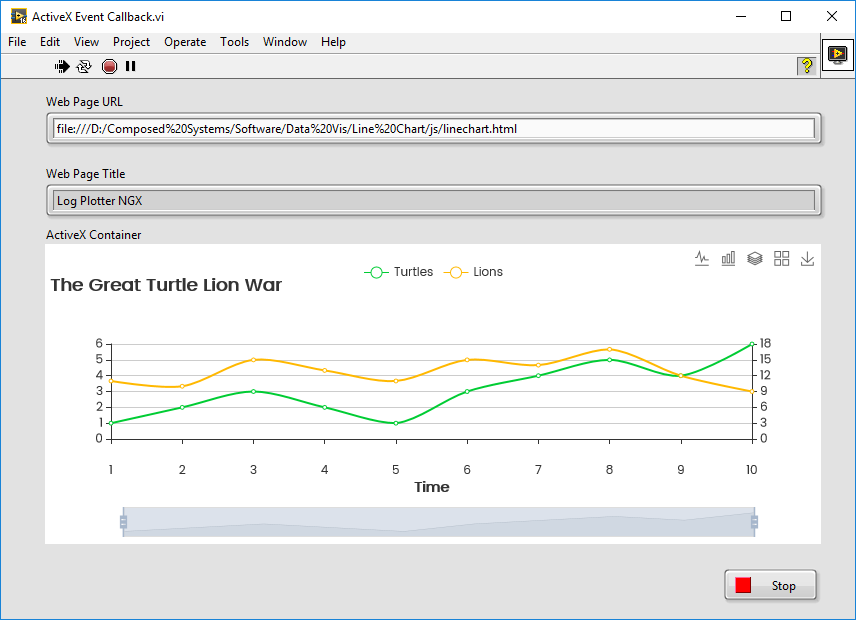 So I now had a way to take the webpage component and view it on a LabVIEW VI's front panel using the ActiveX control. Notice that the Web Page URL is actually pointing to a local file on my hard drive. I don't even need to host the html file for the ActiveX control to be able to run it; and run it is the correct way to talk about it because when the HTML page is loaded it actually executes the JavaScript code embedded inside it. This is cool because it gives me a way to use JavaScript to handle UI elements, which, let's be honest, look and act nicer than anything I want to build with LabVIEW. So this is where the XControls come in. If you aren't familiar with XControls in LabVIEW then take a look here. I didn't need to build much functionality into my XControls because I was only using them to encapsulate my hackery of programmatically updating HTML files and refreshing the webpage in the ActiveX control. To finish I will mention a few caveats. These aren't speedy and I wouldn't use them for display of live data. Their responsiveness suffers with large amounts of data, for this reason I ended up creating a hybrid LabVIEW chart HTML+JavaScript chart that allowed me to do visualization for decimation of the data in LabVIEW and then push a decimated set of data up to HTML+JavaScript for fancy viewing. Another caveat is licensing, if you go the route I went and purchase code from someone else be sure that their license fits your use case. In my case the license I purchased allows me to use this package once and distribute it to customers without selling it to them. If you download the code I post then you inherit that license along with this text here: THE SOFTWARE IS PROVIDED "AS IS", WITHOUT WARRANTY OF ANY KIND, EXPRESS OR IMPLIED, INCLUDING BUT NOT LIMITED TO THE WARRANTIES OF MERCHANTABILITY, FITNESS FOR A PARTICULAR PURPOSE AND NONINFRINGEMENT. IN NO EVENT SHALL THE AUTHORS OR COPYRIGHT HOLDERS BE LIABLE FOR ANY CLAIM, DAMAGES OR OTHER LIABILITY, WHETHER IN AN ACTION OF CONTRACT, TORT OR OTHERWISE, ARISING FROM, OUT OF OR IN CONNECTION WITH THE SOFTWARE OR THE USE OR OTHER DEALINGS IN THE SOFTWARE. Jon McBee is the Founder and Managing Partner at Composed Systems and is a Certified LabVIEW Architect, Certified LabVIEW Embedded Developer, Certified TestStand Developer, an NI Certified Professional Instructor, a LabVIEW Champion, and a Certified ScrumMaster
11 Comments
Andras
2/23/2017 10:27:26 am
What do you mean about large data? At which level this particular approach becomes sluggish? Example: i have 30 channels (curves), and I decimate my data not to exceed the number of pixels of my LabVIEW XY Graph, so lets say 700 data points. So lets imagine 30 curves multiplied by 700. If I push this amount of data, I guess that HTML+javascript chart should deal with it nicely? I am interested, because these charts just look so nice.
Jon McBee
2/23/2017 10:34:52 am
Hi Andras,
Andras
2/23/2017 11:31:59 am
Thanks for the info! I am just a "small player" (LV CLD cert), and almost zero experience with JavaScript/HTML. How easy to customize the line charts for example at the javascript side? Does this Chartli library has a good documentation with examples? I do not think of very fancy things, just some basic customizations, like the position of the Plots Legend, font types, etc...
Omar Mussa
2/23/2017 01:24:39 pm
Great post - I've done similar stuff recently. One thing I'd recommend is looking at plot.ly - it has a js library that is open source and also makes very nice looking plots.
Jon McBee
2/23/2017 04:01:18 pm
Hi Andras, 2/24/2017 02:33:19 am
Hi John,
Jon McBee
3/3/2017 11:01:43 am
Hey James,
Omar Mussa
3/8/2017 11:48:52 am
FWIW - Used some of these materials when presenting yesterday and found one issue that could be easily changed. Currently, the xctl uses a relative path to the html file that is hard coded but prevents the xctl from allowing multiple instances. With a minor tweak, the html generated could use an instance ID so that the html file would be per xctl instance which would allow multiple graphs of same type (for example could use subpanels on a VI to create a dashboard).
Jon McBee
3/8/2017 01:54:13 pm
Hey Omar,
Aart-Jan
12/8/2017 05:32:27 am
Sweet post, Compliments Jon!
David C. Li
12/31/2018 06:56:47 pm
Hey Jon, thanks for the post! Was informative. Leave a Reply. |
Tags
All
Archives
October 2019
LabVIEW Blogs |
||
 RSS Feed

Powered by the Panda Ant
|